
Laboratory Investigations in Microbiology
|
Laboratory Investigations in Microbiology |
|
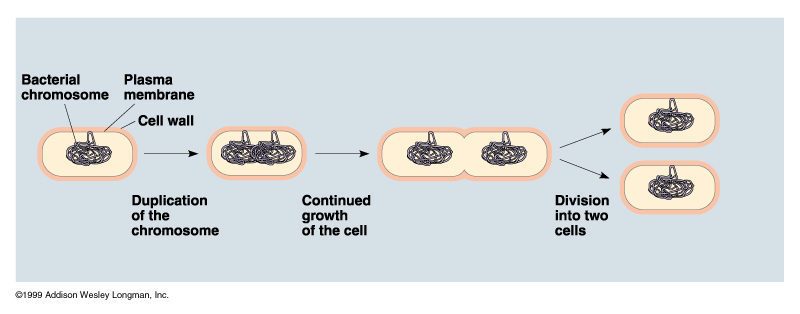
Growth has two connotations when it comes to bacteria: Growth in size and growth in numbers. Like any other organism, bacteria grow larger as they take in nutrients and build more cell components. Rod-shaped and spiral-shaped cells grow longer as well. Eventually, though, a limit is reached, and the cell divides, forming two daughter cells. Usually this happens by binary fission. Most bacteria only grow to ~ twice their normal size before dividing again. Hence, the term 'growth' in bacteriology is usually applied to the growth of populations of bacteria. Most bacterial species, once they start dividing actively, continue to do so until their food runs out, their environment changes, or the waste products build up to toxic levels.
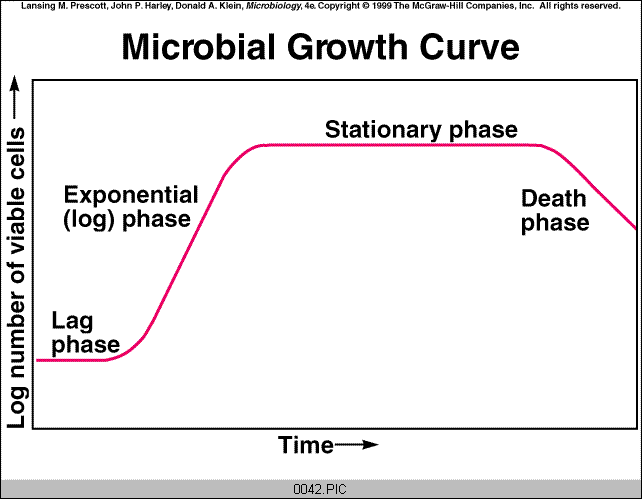
The bacterial growth curve. In a broth culture, bacteria can often be seen going through all 4 phases of a growth curve. Initially, no increase in cell numbers is observed as cells prepare for growth. This is the lag phase. While dividing, they multiply exponentially (exponential phase). The time it takes for a population of bacteria to double in number is called the generation time (or doubling time). For bacteria like E. coli, that time may be as little as 18 minutes. In other words, it would take E. coli only 6 hours to go from one cell to 1 million cells, forming a small but visible colony if on agar. Eventually, growth slows and stops. During the stationary phase, nutrient depletion or waste accumulation has halted growth. In time, the number of viable (living) cells drops as cell death occurs (death phase).
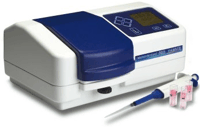
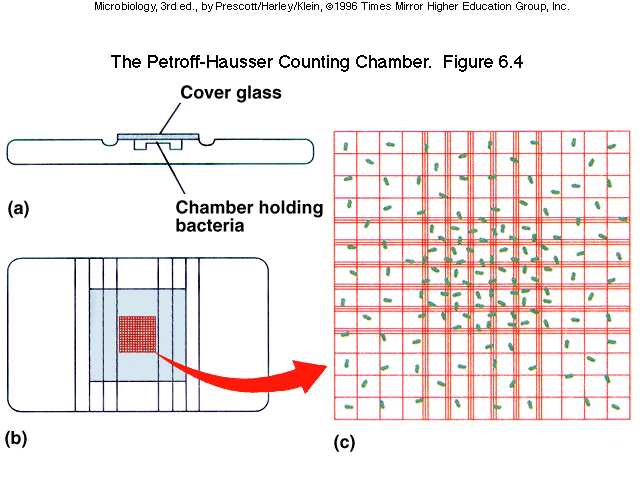
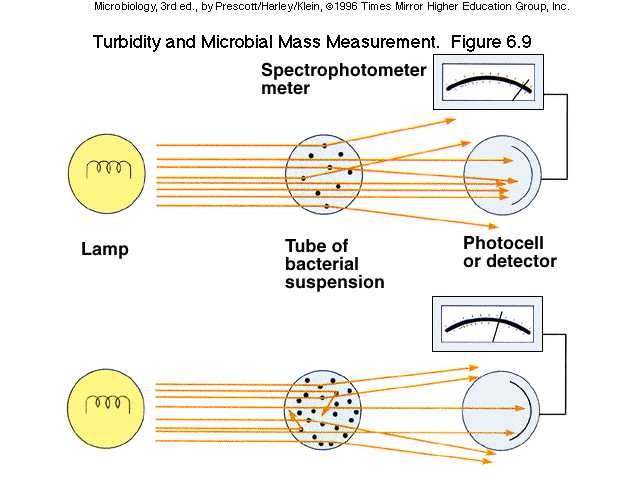
Determining bacterial population size. The size of a bacterial population can be determined by several direct or indirect methods. In direct counting, a sampling of bacteria is fixed and stained and placed into a counting chamber with grids of known volume. The number of cells is counted visually (usually after being diluted) and the number of actual cells calculated from the known volume of the counting chamber and the dilution applied. In indirect counting methods, bacterial cultures are first diluted and then mixed with agar to form pour plates (Ch. 7). Following incubation, each bacterium will have formed a colony. Since colonies are easily counted, the number of cells in the original medium can be determined. Another indirect method takes advantage of the fact that bacterial growth turns a broth cloudy. This cloudiness is called turbidity. The more cells there are, the cloudier the broth. By measuring the amount of light that is absorbed by a broth, using a spectrophotometer, the extent of cloudiness ( and hence, cell number) can be estimated.
Effect of temperature on growth of E. coli. We will make use of turbidity measurements to follow bacterial population growth under varying temperature conditions. The temperatures to choose from are: 4°C, 15°C, 23°C, 35°C, 40°C, 55°C. Before you begin this experiment, you should write down a hypothesis for this experiment: Which of the temperatures used will show the most growth? The least? Why?
Data Sheet & Review Questions (printable)
© 2003 - 2022 José de Ondarza, Ph.D.